import matplotlib.pyplot as plt
import numpy as npMilestone 1
This is jupyter notebook with some python code and markdown text. These can also be included directly into a quarto website.
Import Libraries
Make Plots
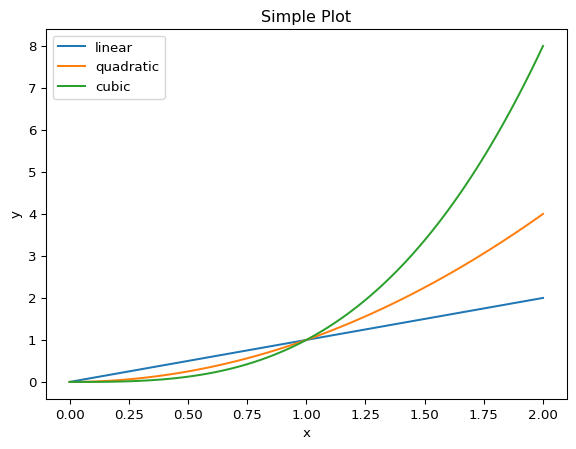
We shall now make a simple plot. Note that by using the quarto option #| code-fold: true , we can hide the code that is used to make the plot and allow it to be expanded as shown below.
Code
import matplotlib.pyplot as plt
import numpy as np
x = np.linspace(0, 2, 100)  # Sample data.

plt.figure()
plt.plot(x, x, label='linear')  # Plot some data on the (implicit) axes.
plt.plot(x, x**2, label='quadratic')  # etc.
plt.plot(x, x**3, label='cubic')
plt.xlabel('x')
plt.ylabel('y')
plt.title("Simple Plot")
plt.legend()
plt.show()